Technical Column
How to create a real-world “Memory Cached Attack” Scenario on EstiNet11
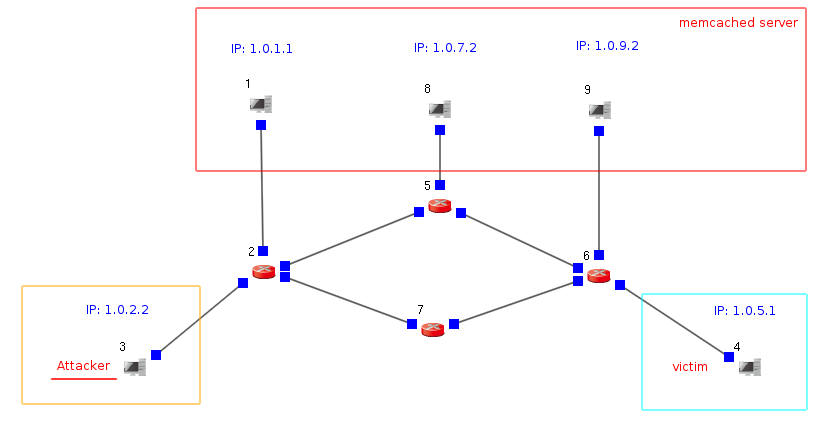
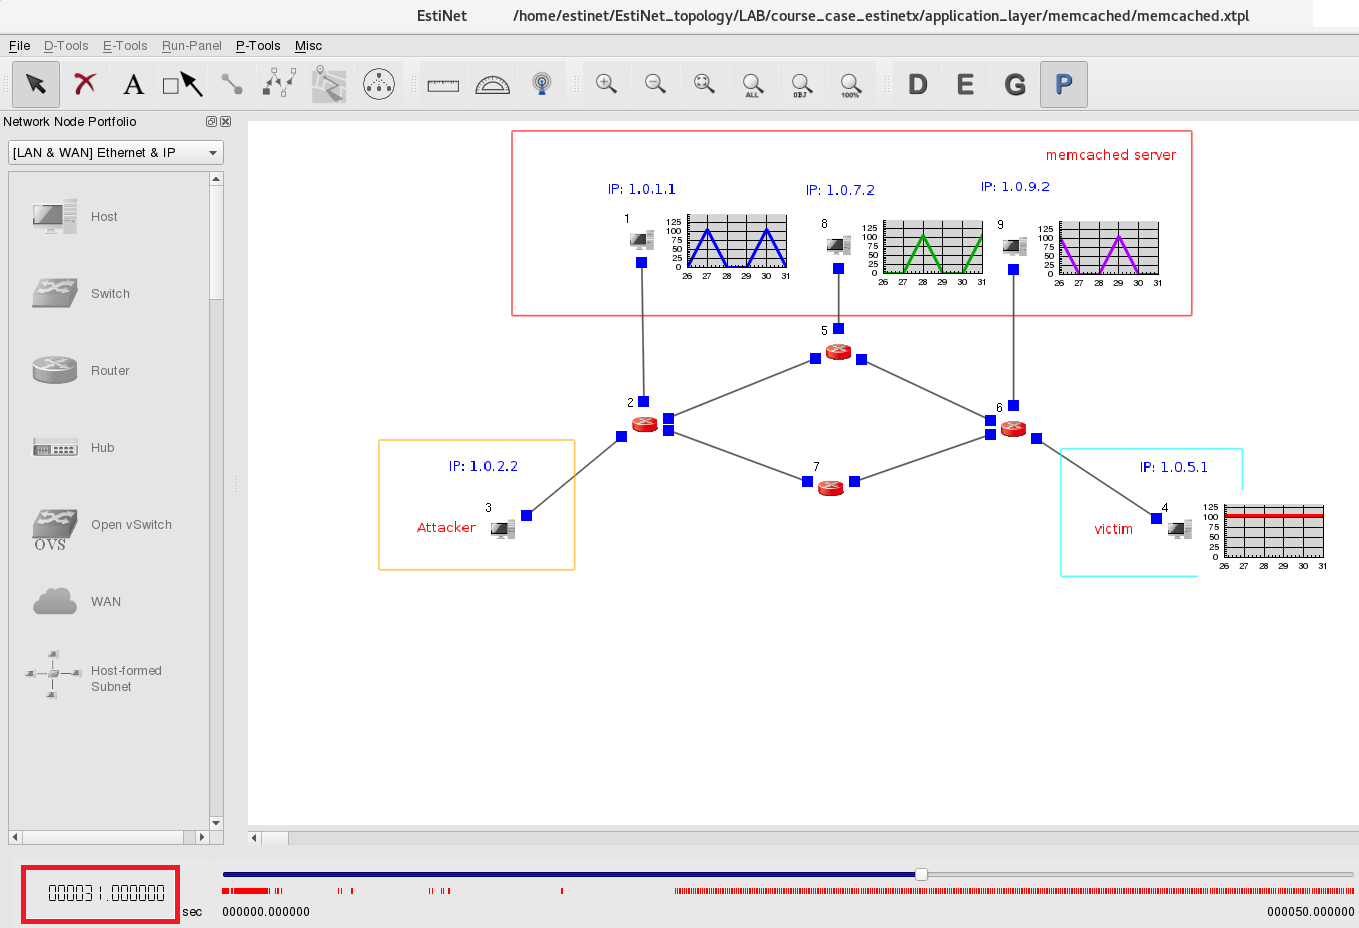
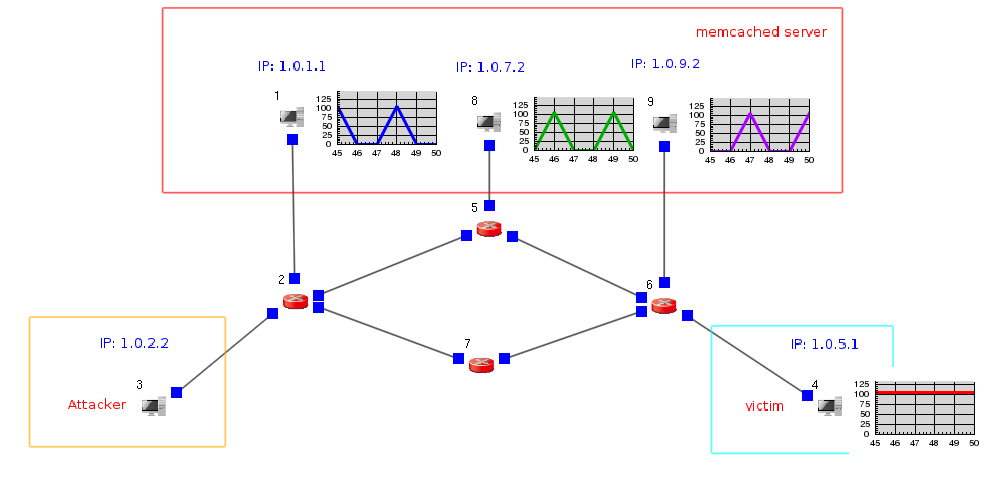
An EstiNet11 user can create a network topology as above. In this topology, Node3 plays as a malicious attacker; Node4 plays as a victim; and Node1, Node8, Node9 play as servers that run memory cached services.
Use Host Node and Router Node
  to create a topology as above on the EstiNet11 platform manually, or a user can decompress the example file “memcached.tar.bz2” to use the included topology description file “memcached.xtpl” as the example topology. The followings are the step-by-step tutorial for creating this case:
1 Set the Duration of SimulationSet the duration of a simulation run:
Set the duration of a simulation run:
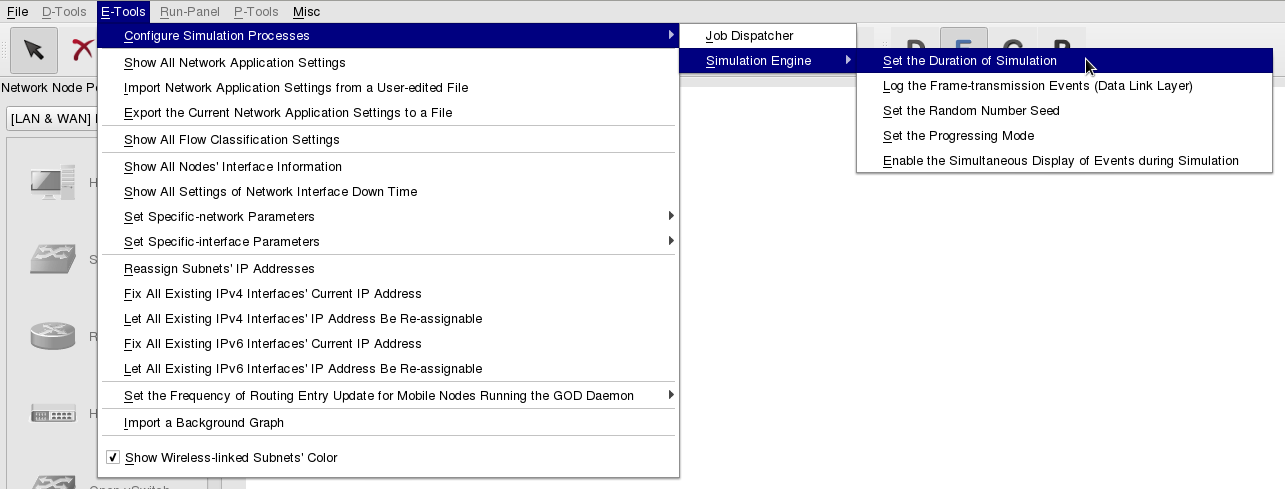
From tool bar E-Tools => Configure Simulation Processes => Simulation Engine => Set the Duration of Simulation
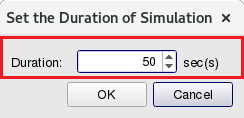
Set the duration as 50 sec(s) in this example.
2 Set the Parameters for this Memory Cached Exemplary Scenario
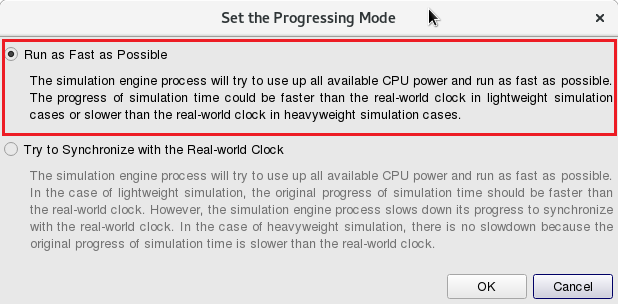
From E-Tools => Configure Simulation Processes => Simulation Engine => Set the Progressing Mode
Click the item “Run as Fast as Possible”.
In  E status (Edit Parameters), the parameter settings under Node3 Host
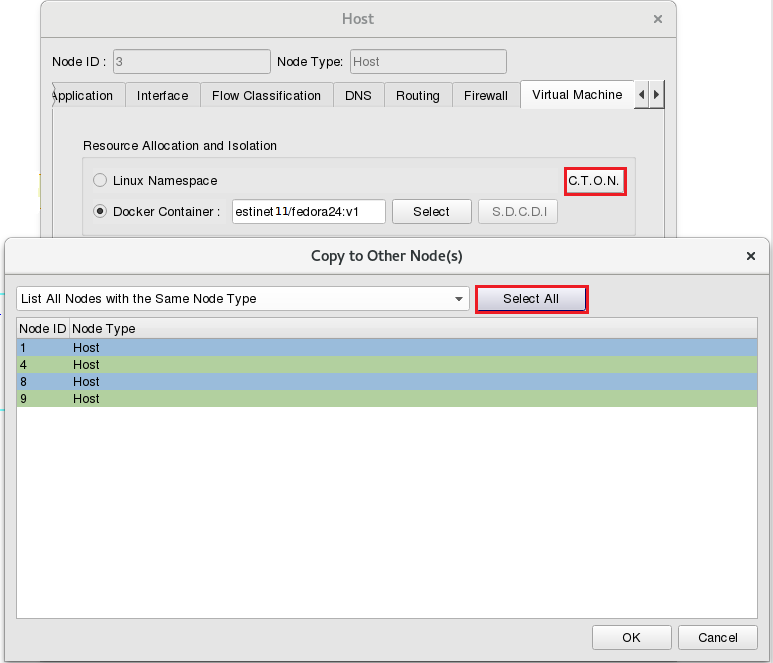
  , please click Tab “Virtual Machine” then select the Docker image “estinet11/fedora24:v1” as the used Docker image.
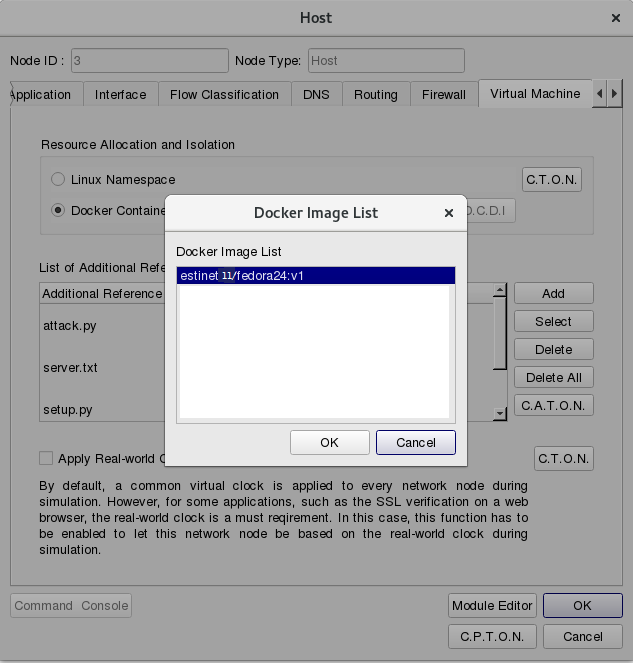
Please click ”C.T.O.N.”(Copy to Other Nodes), then select Node ID 1, 4, 8, 9 or click button “Select All” in this dialog. In this example, all Host Nodes shall run Docker Container to load real-world network programs and services.
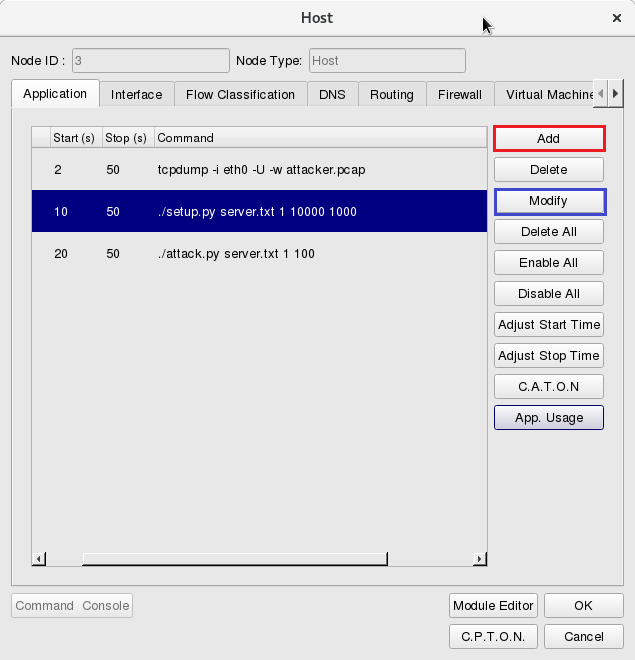
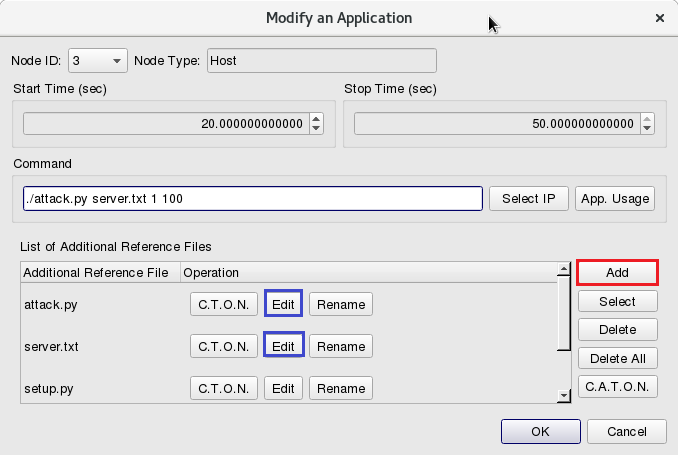
which runs the attacker program, click Tab Application to set up the property of each application.
During simulation time 2~50 secs, use the command “tcpdump” to log packets: tcpdump -i eth0 -U -w attacker.pcap
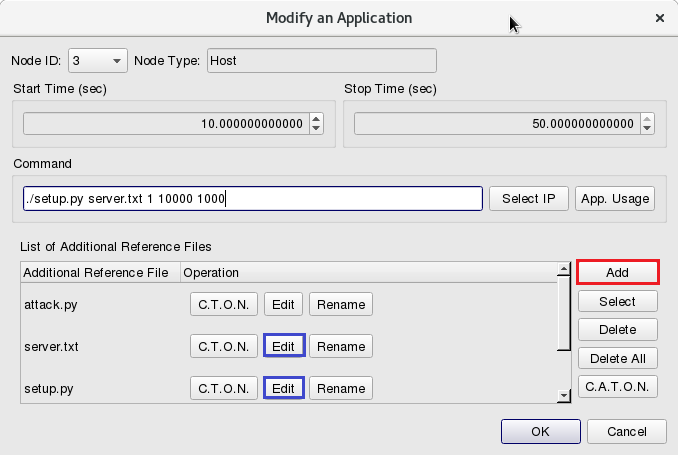
During simulation time 10~50 secs, use the program of “setup” with the following command: ./setup.py server.txt 1 10000 1000
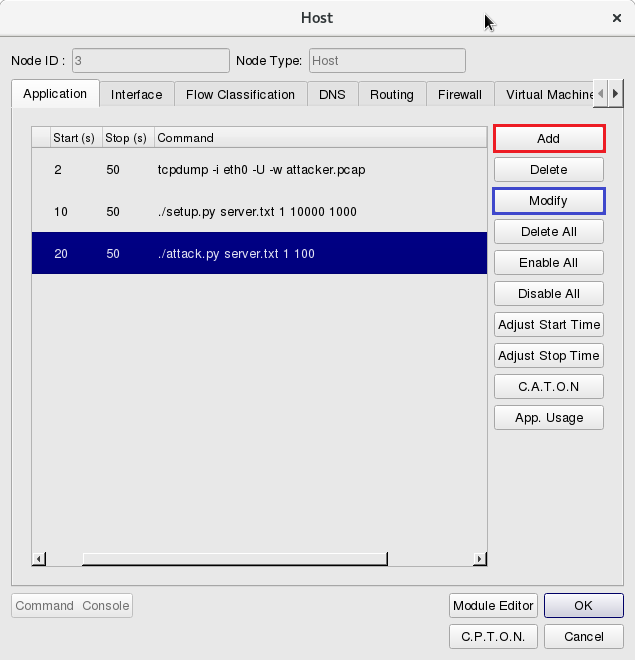
During simulation time 20~50 secs, run the program of “attack”: ./attack.py server.txt 1 100
(If a user uses the example file “memcached.xtpl”, he/she can click Modify and Edit to check the parameters.)
- The content of file server.txt is used by those services that run the memory cached service, e.g., Node1, 8, and 9. The IP addresses of these three Nodes are:
1.0.1.1
1.0.7.2
1.0.9.2
Click Add to add the attack program ./attack.py server.txt 1 100
(If a user uses the example file “memcached.xtpl”, he/she can click Modify and Edit to check the parameters.)
- The program attack.py should be given with victim’s IP addresses as its parameter. In this example, the Node4 victim’s IP is 1.0.5.1.
#!/usr/bin/python
from scapy.all import *
import sys
import threading
victim_address = "1.0.5.1"
victim_port = 80
Set the parameters of these three memory cached servers Node1, Node8 and Node9 in the same way.
During the simulation time 2~50 secs, execute the program “memcached” with this command:
memcached -u memcached -p 11211 -m 64 -c 1024
(The binary file memcached is already included in the prepared Docker Container: estinet10/fedora24:v1. Please notice that the version of EstiNetX must be equal or larger than 10.0.6.1240 to support this Docker image.)
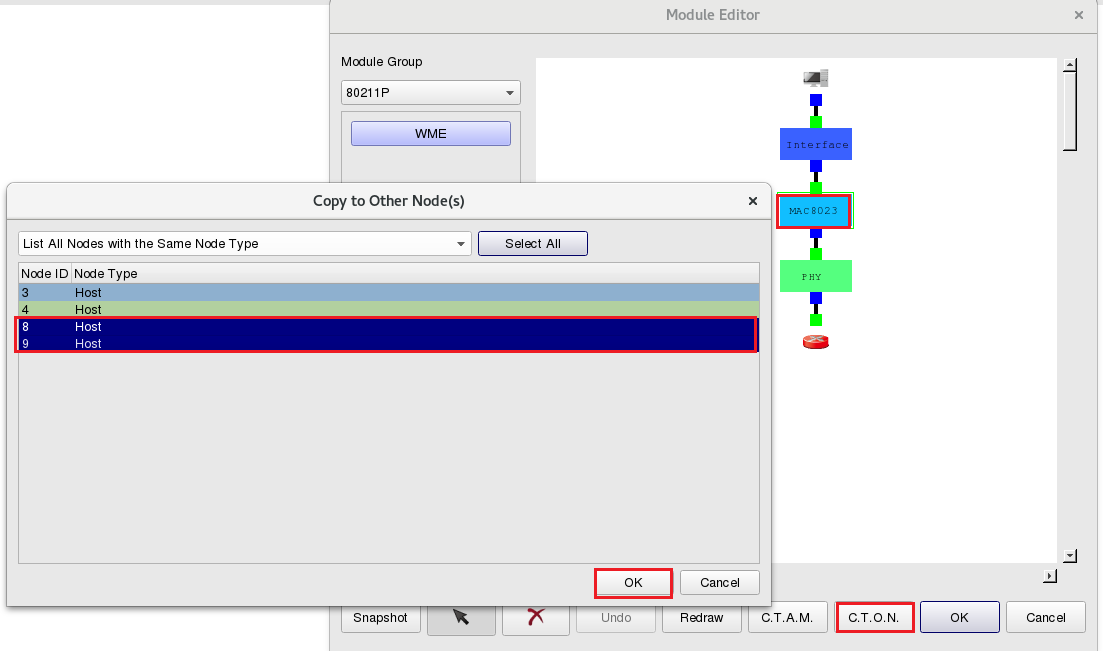
Please click ”C.T.O.N.”(Copy to Other Nodes) then select Node ID 8,9 to complete the settings in tab “Application”.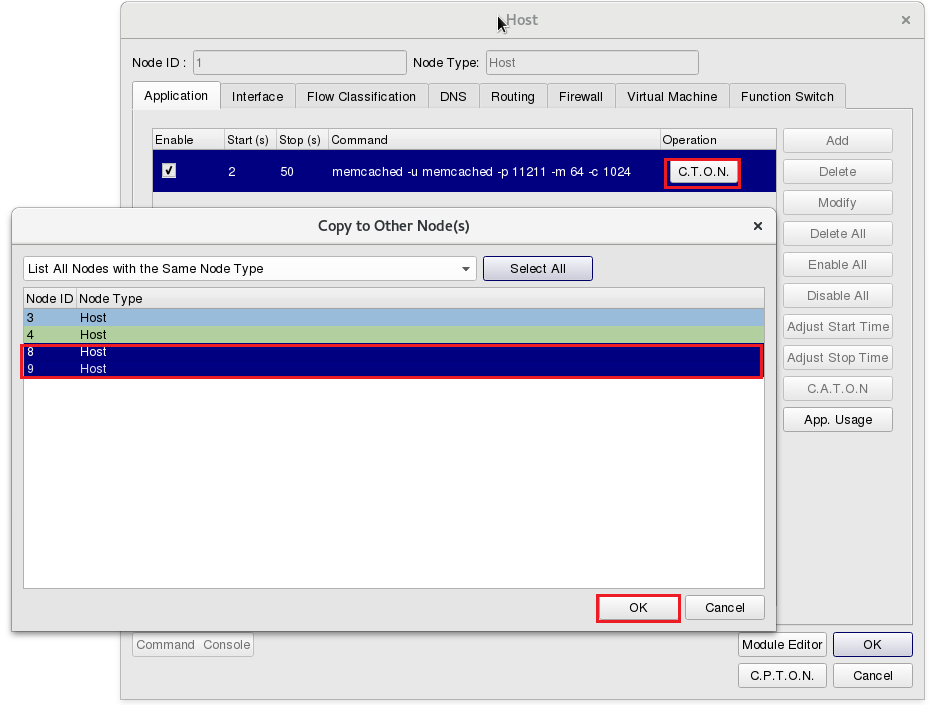
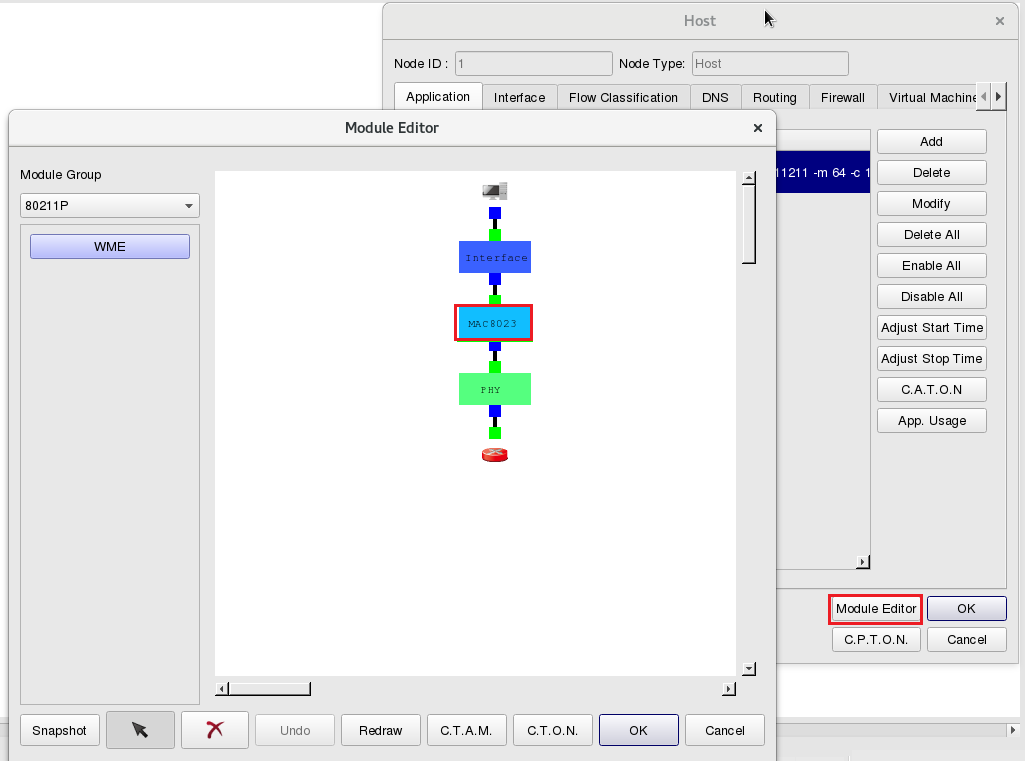
To log the throughputs from/to the attack server, please click “Module Editor” and click Module ![]() “MAC8023” for this setting.
“MAC8023” for this setting.
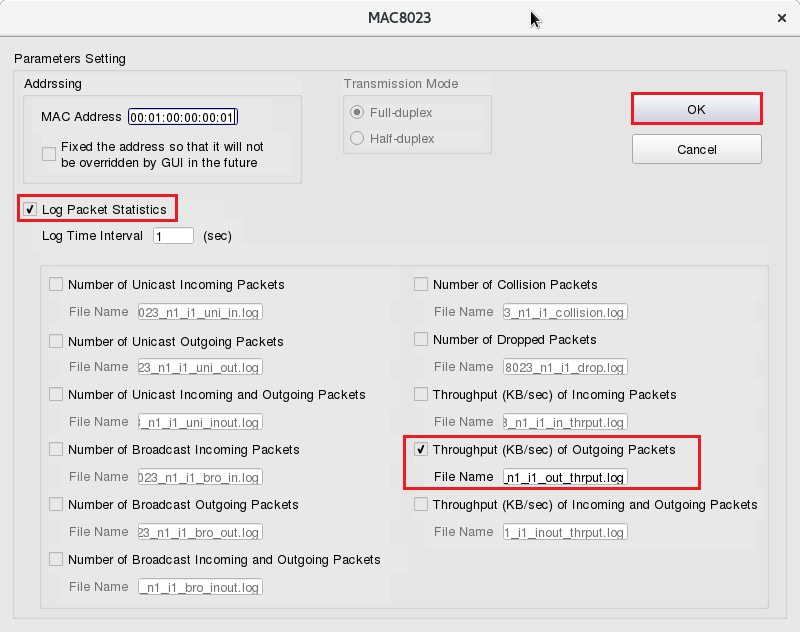
Please select “Log Packet Statistics” and “Throughput (KB/sec) of Outgoing Packets”.
To copy the settnigs from Node1 to Node8 and Node9, after clicking “OK”, please select Module![]() “MAC8023” then click ”C.T.O.N.”(Copy to Othe Nodes) with Node ID 8, 9 to complete the settings of the memory cached servers.
“MAC8023” then click ”C.T.O.N.”(Copy to Othe Nodes) with Node ID 8, 9 to complete the settings of the memory cached servers.
After the above steps, set the parameters of the applications running on victim Node4.
During simulation time 2~50 secs, use the tool “tcpdump” to log packets with this command: tcpdump -i eth0 -U -w node4.pcap
To log the throughputs of victim Node4. From Module ![]() “MAC8023” in “Module Editor”, click “Log Packet Statistics” and “Throughput (KB/sec) of Incoming Packets” to observe the changes of the victim node’s throughputs during simulation.
“MAC8023” in “Module Editor”, click “Log Packet Statistics” and “Throughput (KB/sec) of Incoming Packets” to observe the changes of the victim node’s throughputs during simulation.
3 Execute the Simulation
Click the G button  to change into the G mode (Generate Configuration Files). Then, select Run-Panel => Start Simulation to start a simulation.
4 Observe the Simulation Result
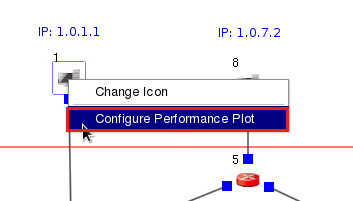
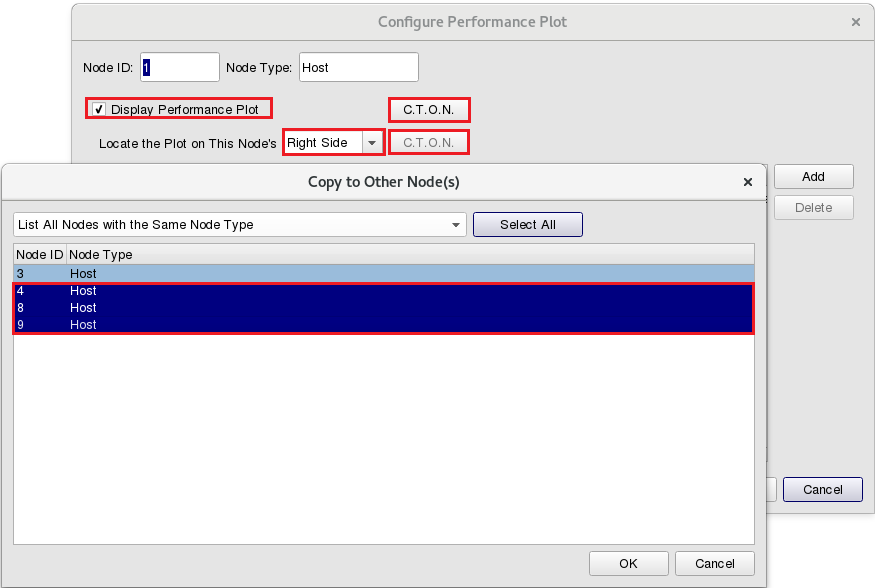
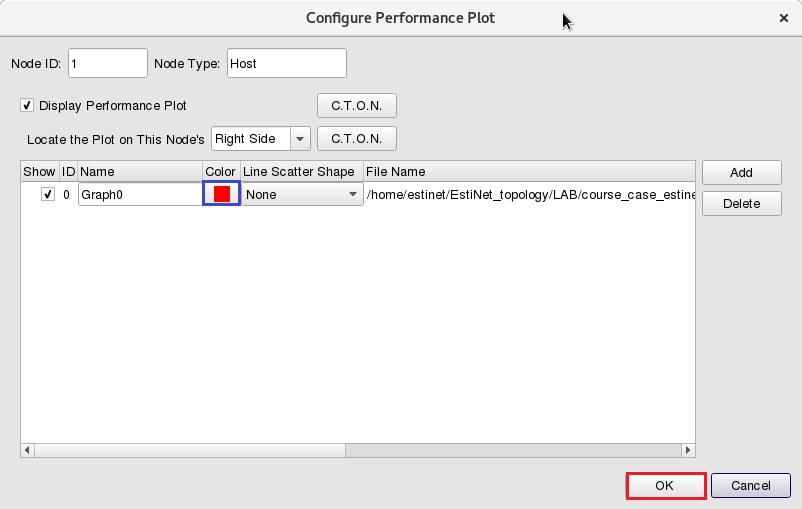
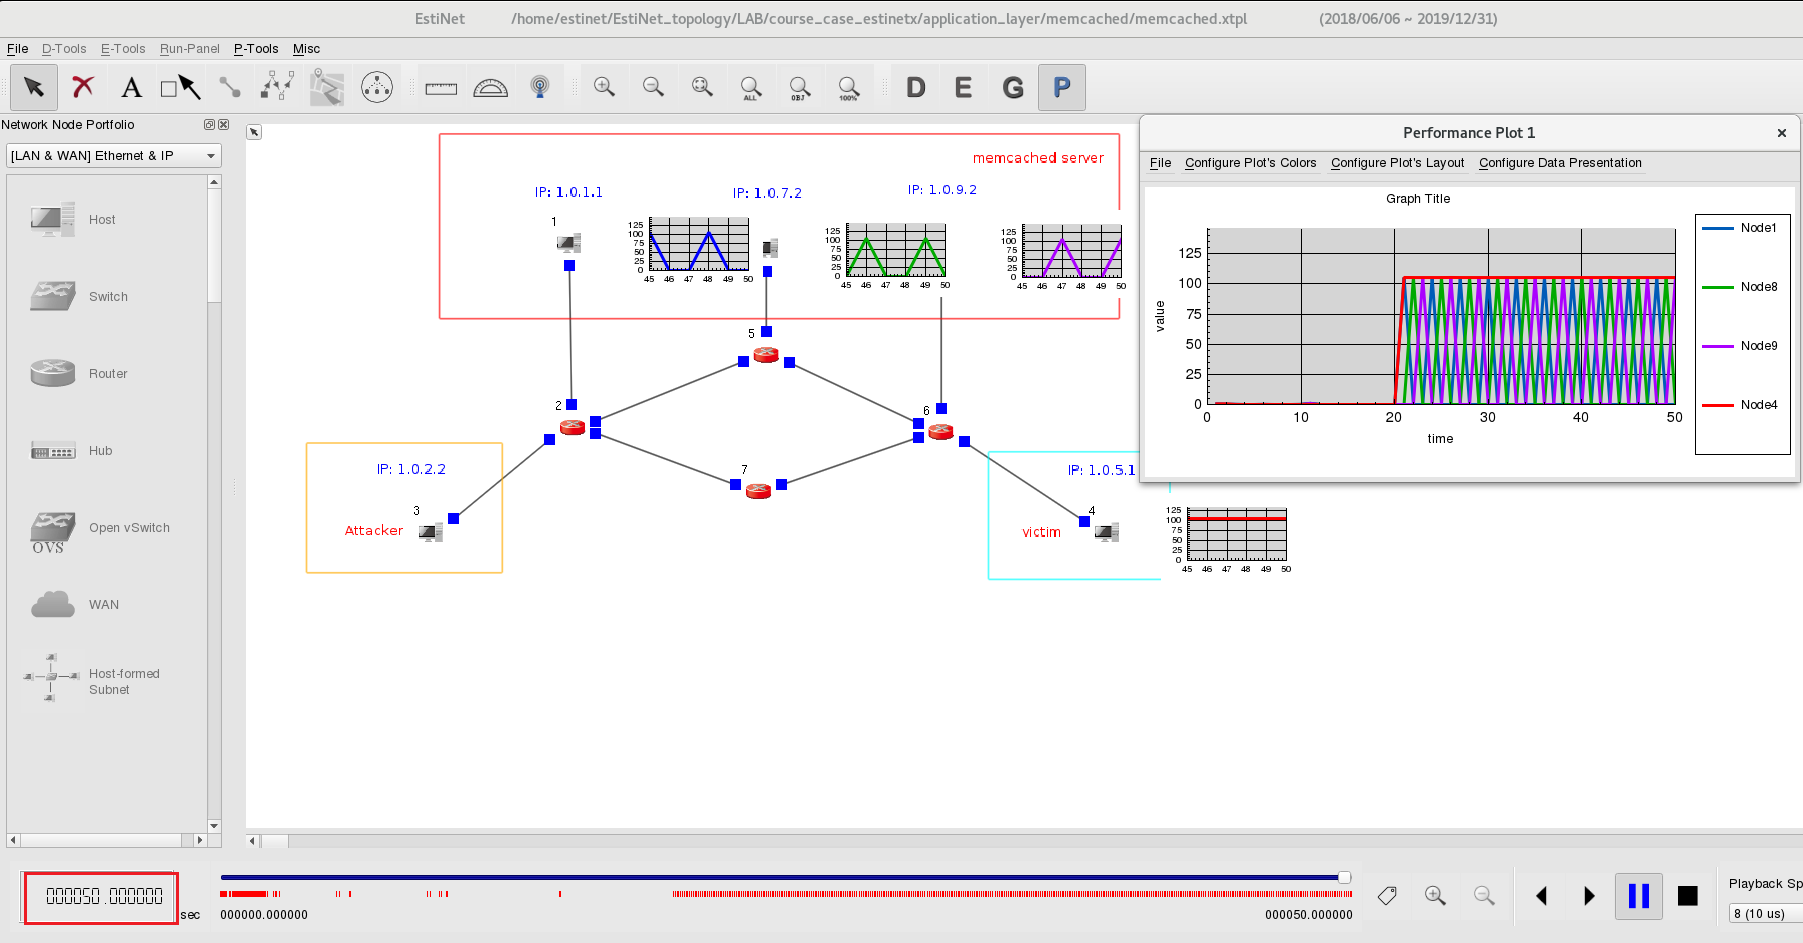
After the simulation is completed, EstiNetX will change to P status (Play Back Results) automatically. In this example, we can observe the interaction between memory cached servers Node1, Node8 and Node9 and victim Node4. Click the right button of Node1; then select “Configure Performance Plot”, and click “Display Performance Plot”. Finally, select Locate the Plot on This Node’s “Right Side”.
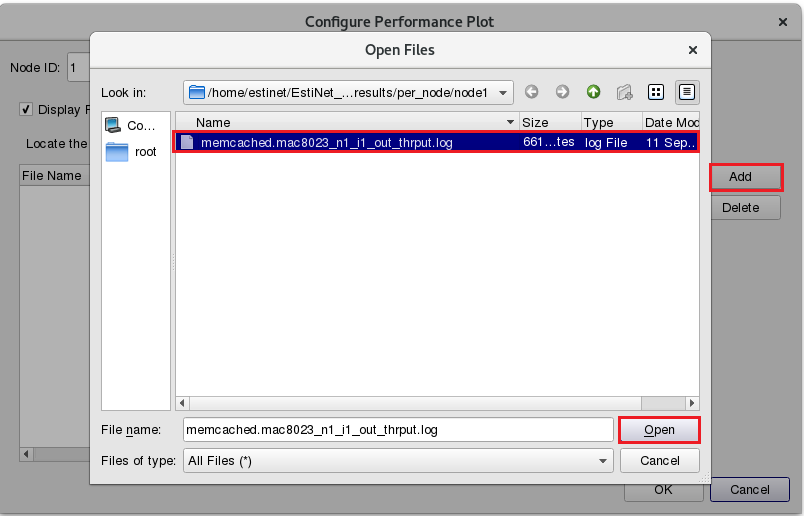
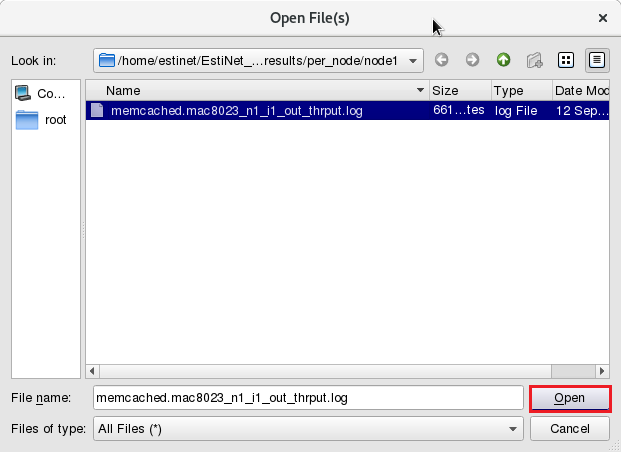
Please use “C.T.O.N.” (Copy to Other Nodes) to copy the same settings to Node8, Node9 and Node4. Then click the button “Add” and select the throughput file of Node1. The outgoing throughput file path of Node1 is /memcached/memcached.results/per_node/node1/memcached.mac8023_n1_i1_out_thrput.log
Please click the column “Color” to change the color of the line in the specified throughput chart, when needed. Same changes can be applied to those figures on Node8 and Node9.
If we want to set up the incoming throughput for Node4. The path of Node4’s incoming throughput file path is: /memcached/memcached.results/per_node/node1/memcached.mac8023_n1_i1_out_thrput.log
Click the button Play ![]() to observe the interaction between the Nodes’ packet flows and the related throughputs on Nodes.
to observe the interaction between the Nodes’ packet flows and the related throughputs on Nodes.
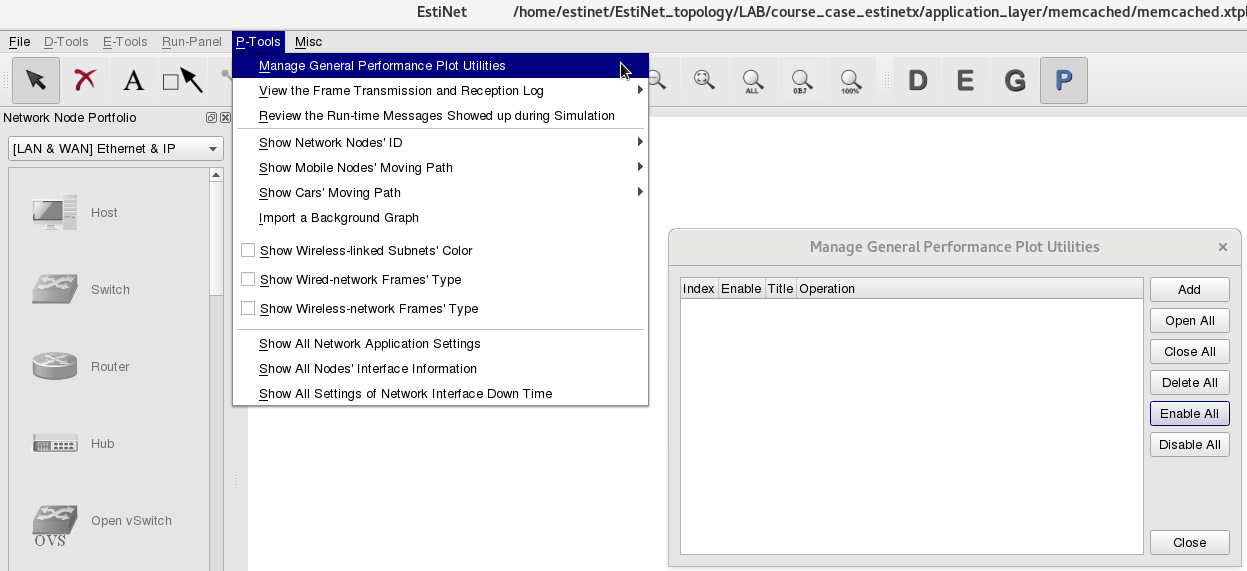
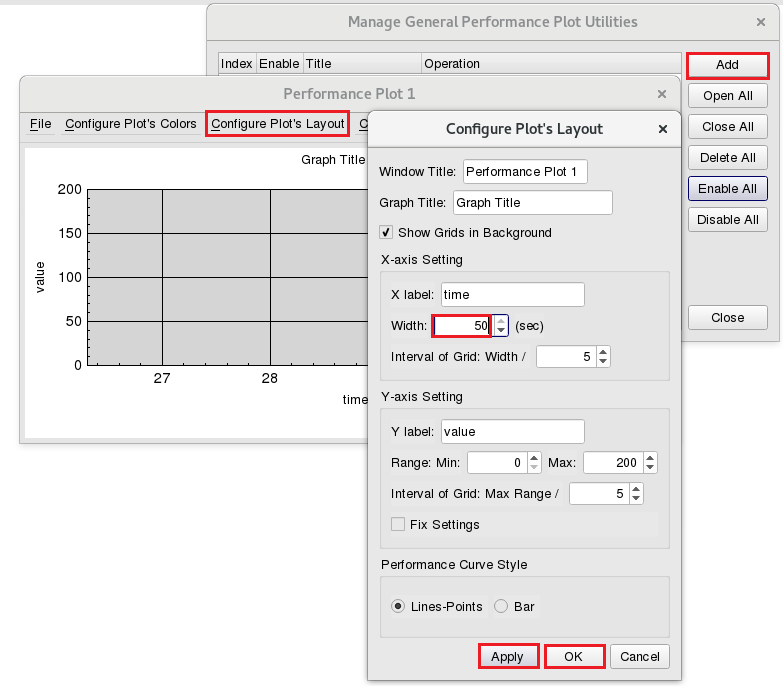
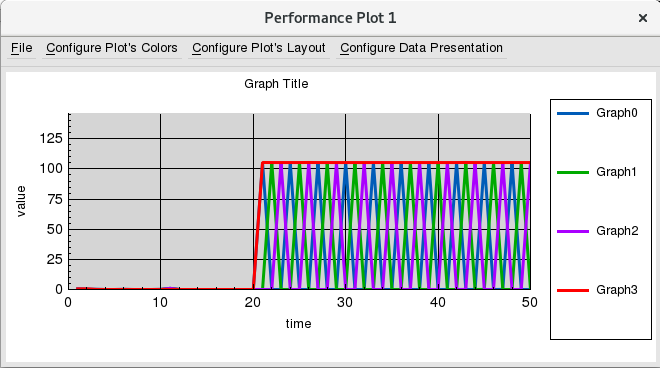
At the 31th second of the simulation time, the sum of total outgoing throughput from memory cached servers (memcached server) Node1, Node8 and Node 9 is the same as the incoming throughput of Node4 from above figure. There is another method to observe the throughput results: from P-Tools => Manage General Performance Plot Utilities.
Click ”Add” then click ”Configure Plot’s Layout” in dialog Perfncormae Plot 1.
Click ”Configure Plot’s Layout” then set the X-axis width as 50 secs, since the total simulation time is 50 seconds. Please click “Apply” and “OK” to finish the settings.
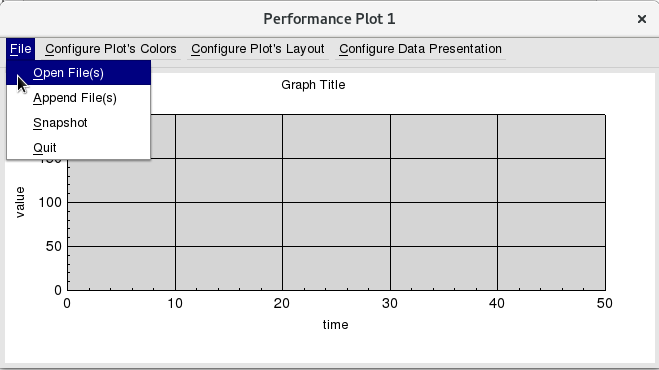
Then click “File”=>”Open File(s)” to select the outgoing throughput log file of Node1.
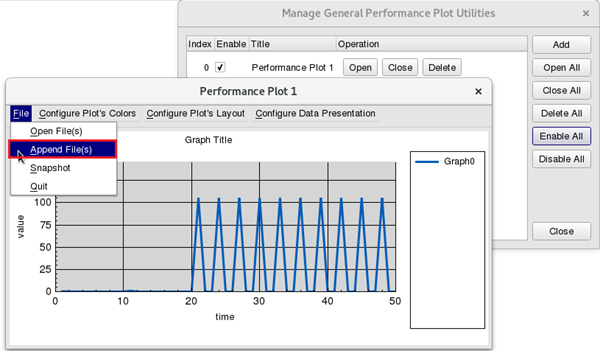
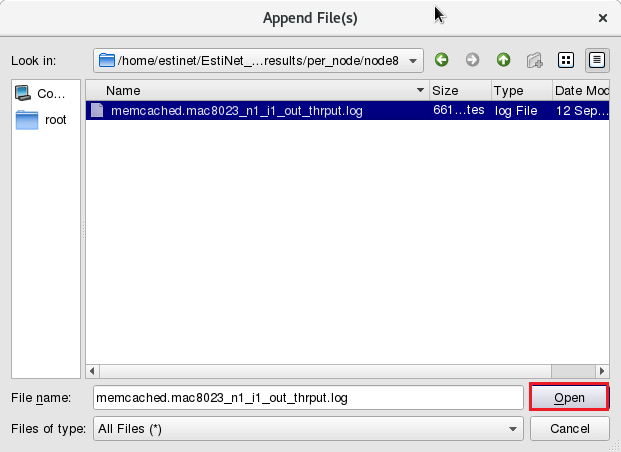
Click “File” => “Append File(s)” to add the outgoing throughput log file for Node8,Node9 and incoming throughput log file for Node4.
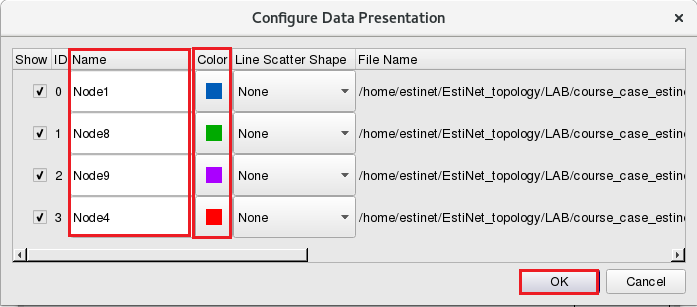
At last step, click “Configure Data Presentation” to modify the present of “Name” and “Color”.
At the 50th second of the simulation time, we can clearly observe the whole throughputs between three memory cached servers and the victom.
We also can observe the packet log file from attacker Node3. The file path is /memcached/memcached.results/per_node/node3/attacker.pcap)
In this example, the reflection attackers are memory cached server Node1 (IP: 1.0.1.1), Node8 (IP: 1.0.7.2) and Node9 (IP:1.0.9.2). Use TCP connection to set batch data from Node3. To Node1, Node8 and Node9.
From Node3 (IP: 1.0.2.2) to Node1 (IP: 1.0.1.1).
From Node3 (IP: 1.0.2.2) to Node8 (IP: 1.0.7.2).
From Node3 (IP: 1.0.2.2) to Node9 (IP: 1.0.9.2).
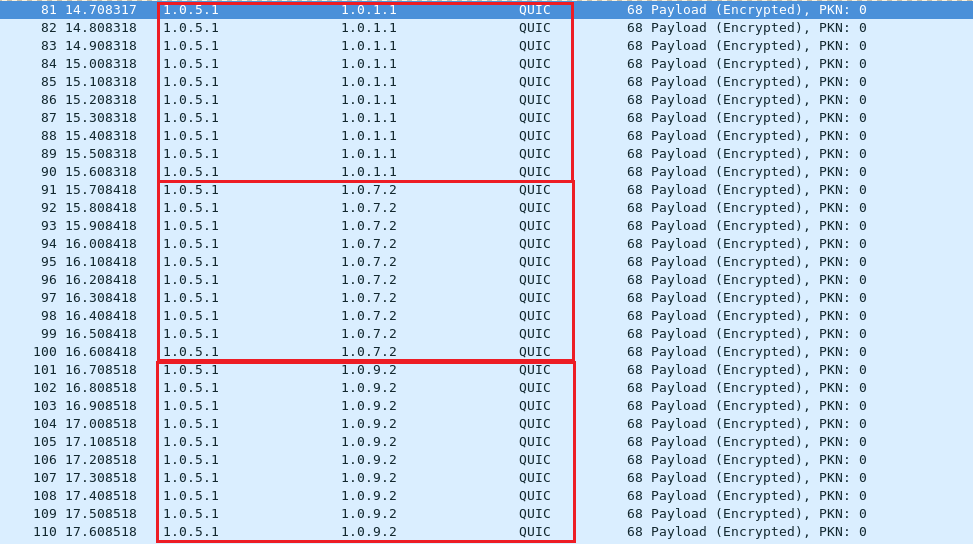
Use UDP packets from the attacker (Node3) with a fake source IP to request the reply to victim (Node4). This way, we can observe a large number of large packets replied to the victim from the memory cached servers. Which is triggered by small query packets from the attacker.
The victim is Node4 (IP: 1.0.5.1)
The attacker Node3 used fake source IP (IP: 1.0.5.1) to do UDP memory cached query.
From Node3 (fake source IP: 1.0.5.1) to Node1 (IP: 1.0.1.1)
From Node3 (fake source IP: 1.0.5.1) to Node8 (IP: 1.0.7.2)
From Node3 (fake source IP: 1.0.5.1) to Node9 (IP: 1.0.9.2)
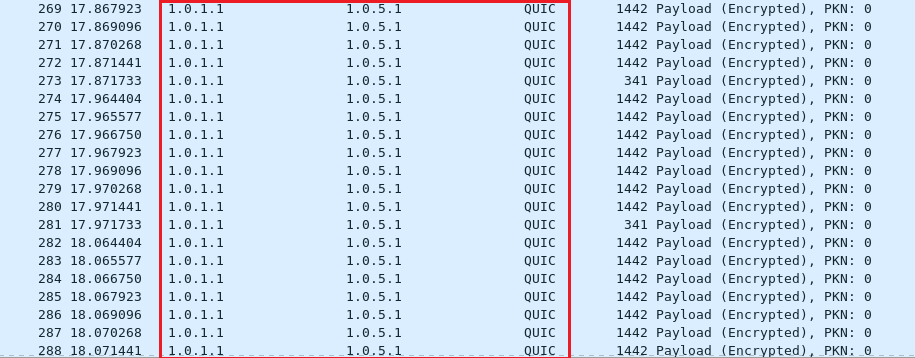
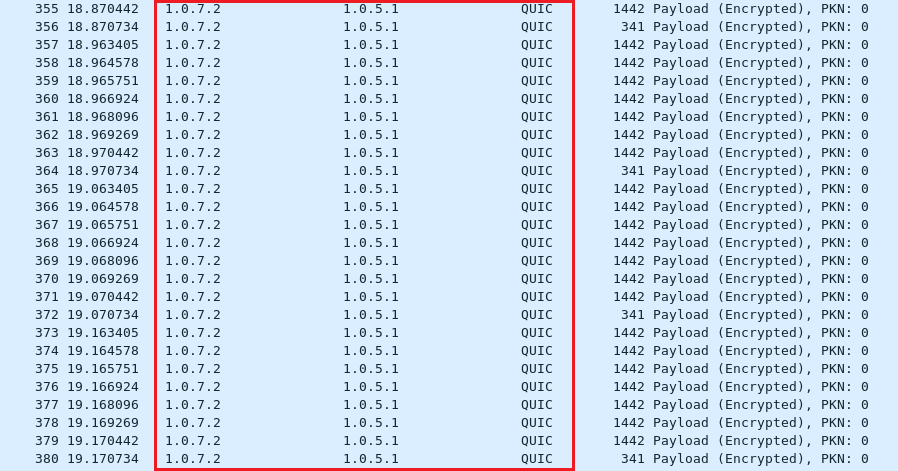
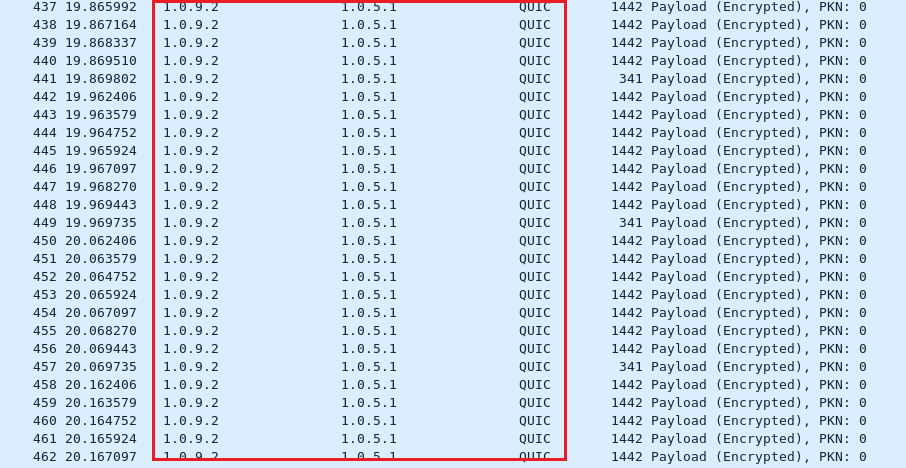
Node4 (IP: 1.0.5.1) received the UDP memory cached reply.
From Node1 (IP: 1.0.1.1) to Node4 (IP: 1.0.5.1)
From Node8 (IP: 1.0.7.2) to Node4 (IP: 1.0.5.1)
From Node9 (IP: 1.0.9.2) to Node4 (IP: 1.0.5.1)
We can observe the packet size and packet number of UDP replies are larger than UDP queries.

